The project at a glance
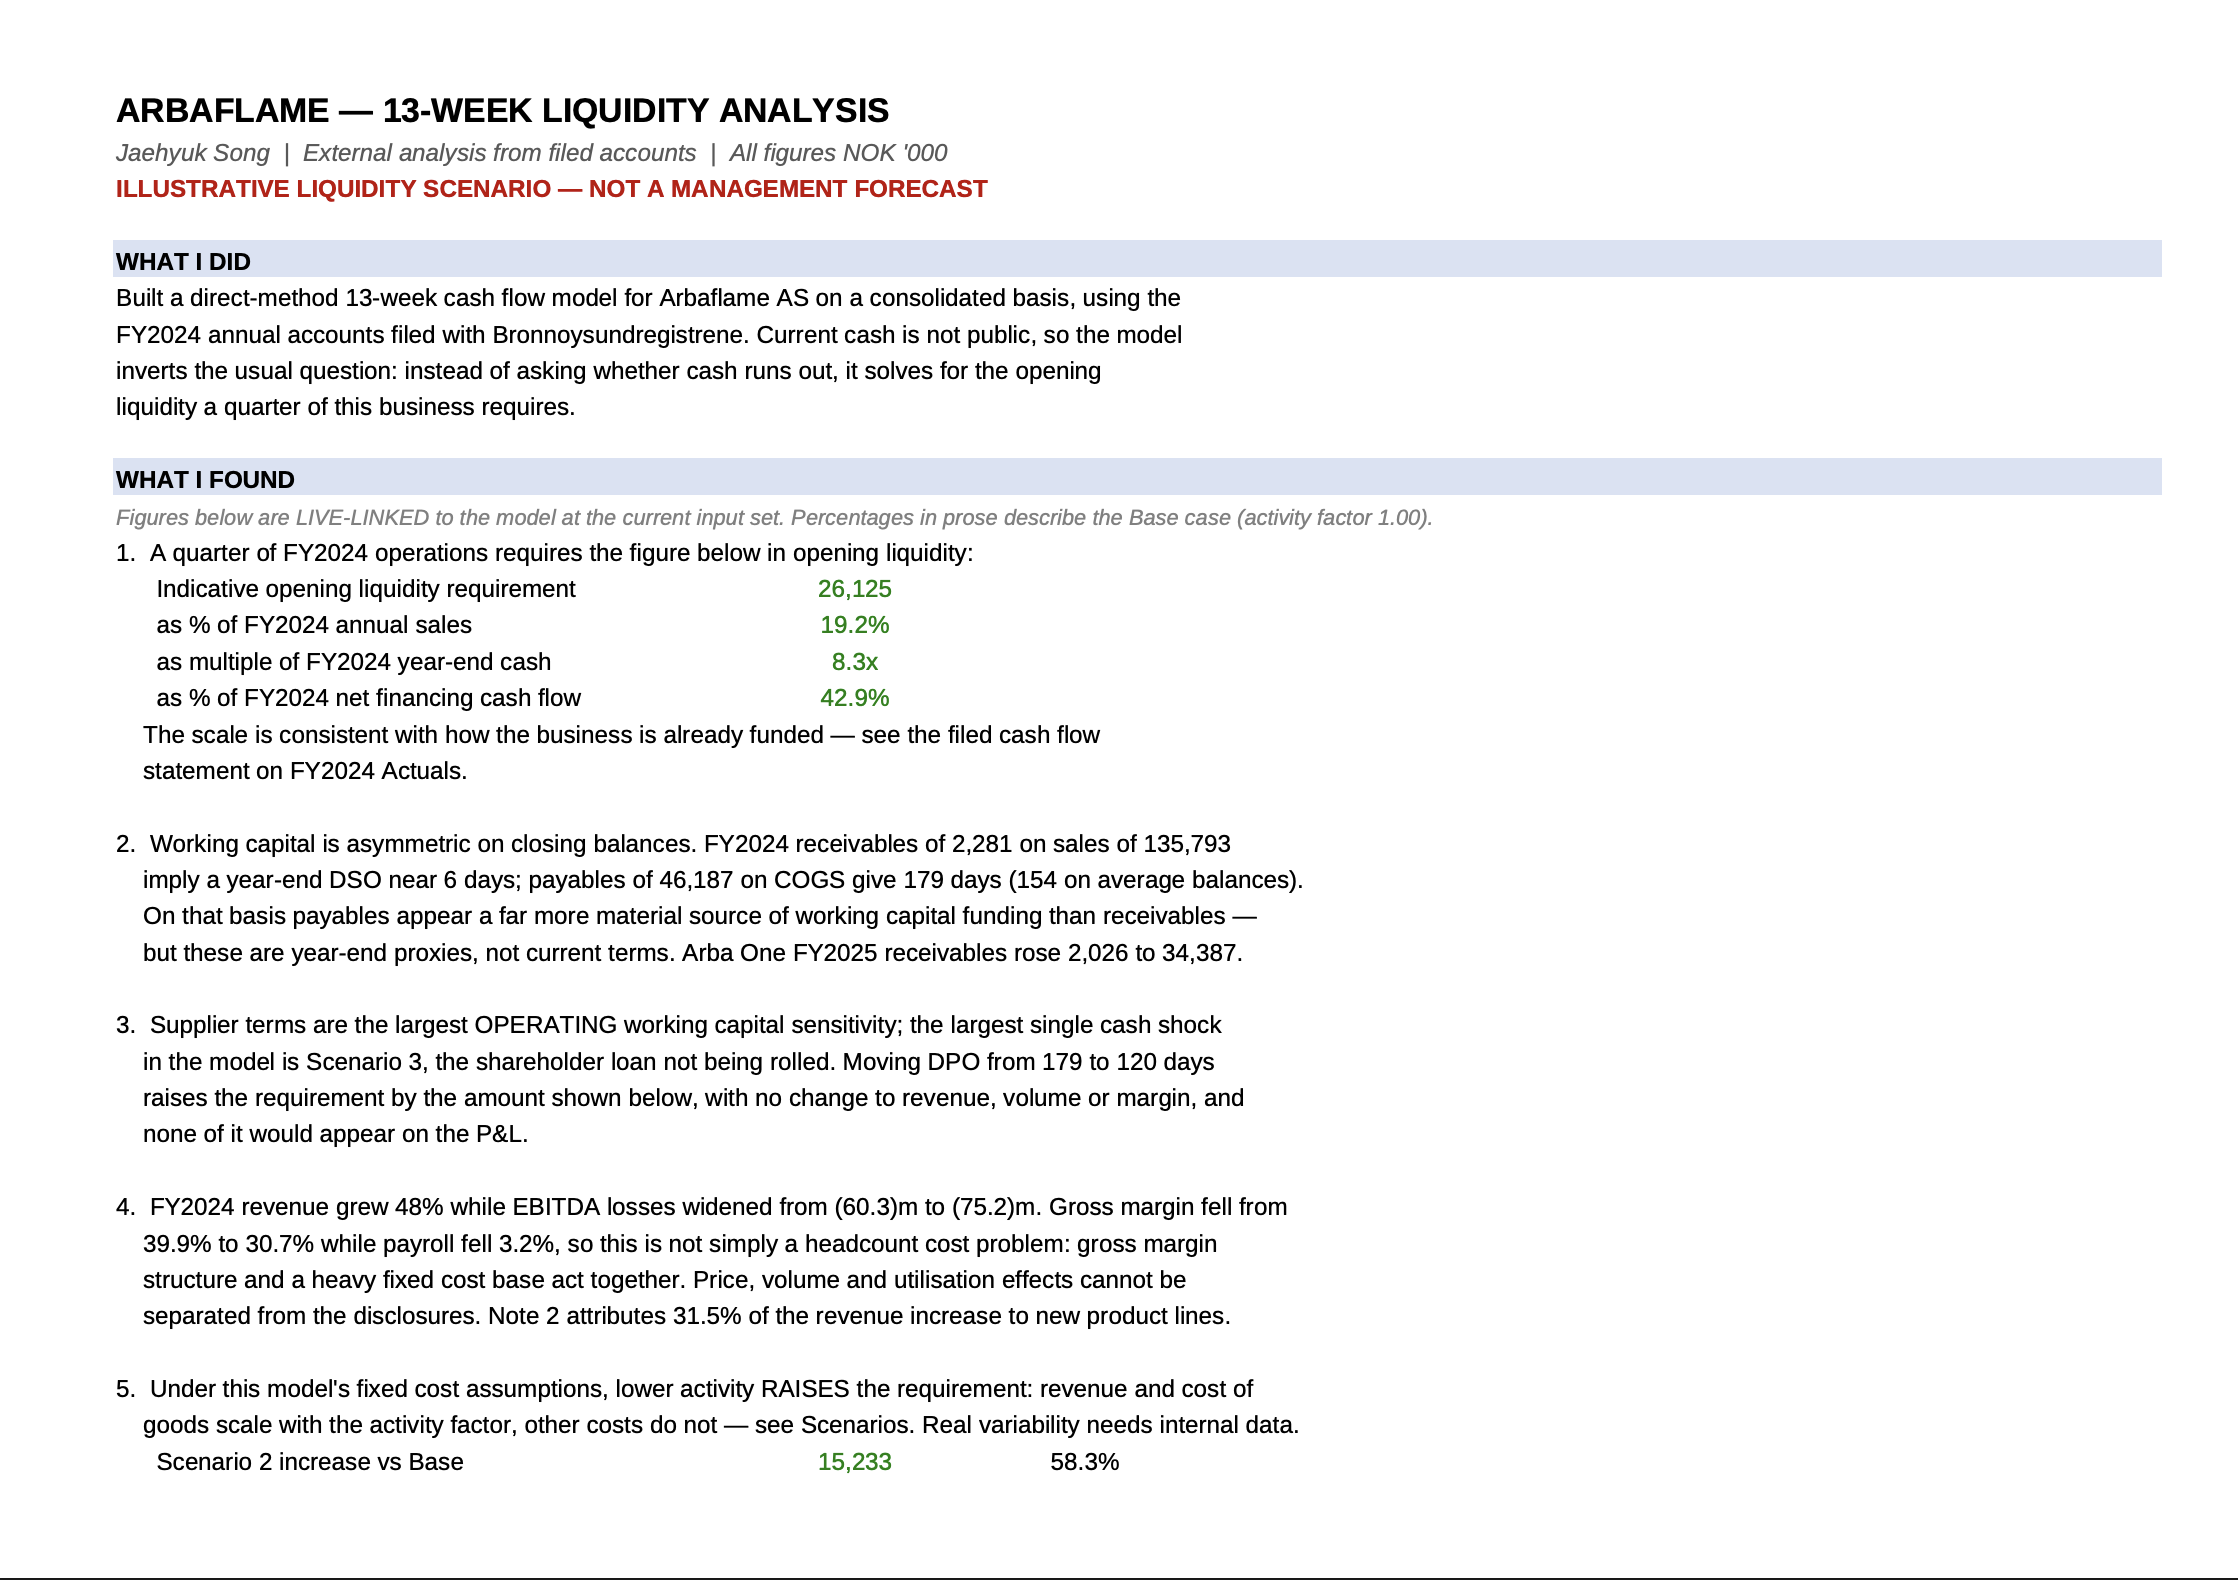
Original project overview. Open to read at full size. Figures are illustrative model outputs.
The business question
How much opening liquidity would a quarter require?
A standard cash-flow forecast starts with today’s bank balance. That figure was not publicly available. This independent model reverses the question: what opening cash would be needed to clear 13 weeks under the stated assumptions?
Scope matters
Illustrative liquidity scenarios based on FY2024 consolidated run-rates. This is not a management forecast, a client engagement, or a statement about Arbaflame’s current funding needs.
Method & tool choice
I built a direct-method model in Excel, mapping receipts and payments week by week. Excel makes the assumptions, linked schedules, and reconciliation checks inspectable.
- Anchor the group model to filed FY2024 consolidated accounts.
- Keep the operating subsidiary’s FY2025 accounts separate rather than mixing different entity scopes.
- Compare a base case, tighter supplier terms, and repayment of a shareholder loan.
- Include a source register and a forecast-versus-actual tracker for a future weekly roll.
Three assumptions. Different cash requirements.
Illustrative scenarios · FY2024 run-rates
Source: independent 13-week model, pp. 1–2.
Not a forecast of the company’s current cash needs.
Tightening modeled days payable from 179 to 120 increases the opening requirement from NOK 26.125m to NOK 41.358m: approximately 58.3%. Revenue and margin do not change in that scenario.
Supplier terms are the largest operating working-capital sensitivity described in the report. The largest single modeled cash shock is the separate shareholder-loan repayment scenario, at NOK 58.427m.
Model outputs transcribed from report pages 1–2; millions converted from NOK ’000. They are not observed company outcomes.
Why it matters
The model distinguishes profitability from payment timing. It gives a finance team a way to identify which missing information to request first—bank balances, invoice aging, and contractual payment dates—before relying on a cash forecast.
Validation & limitations
The report documents subtotal integrity checks, scenario reconciliations, and preserved rounding differences in the filed accounts. The portfolio’s web chart has been checked against the report; the underlying workbook has not been independently rerun for this website.
Annual averages are a rough proxy for weekly activity. Current bank balances, customer aging, supplier contracts, and exact debt-service dates are unavailable. Year-end working-capital ratios do not establish current contractual payment terms.
The model uses an older consolidated reporting period. The report’s statements about filing availability apply at its model date and have not been refreshed for this page.
What I learned
A useful model begins with an answerable question. When a key input is unknown, changing the question can be more defensible than filling the gap with an assumed fact.
Read the full model report (PDF)